Now in its third year, the Life in the UK index is beginning to tell a longer-term story of what life is like for people who live in the UK. Despite some signs of hope, in 2025 life in the UK predominantly remains characterised by persistent inequality and wellbeing stagnation.
- Democracy
- Economy
- Environment
- Evidence and reports
- Inequality
- Measuring wellbeing
- Society
- Carnegie UK
- 27 October 2025
- ISBN: 978-1-917536-04-2
- 18 minute read
Our collective wellbeing in 2025
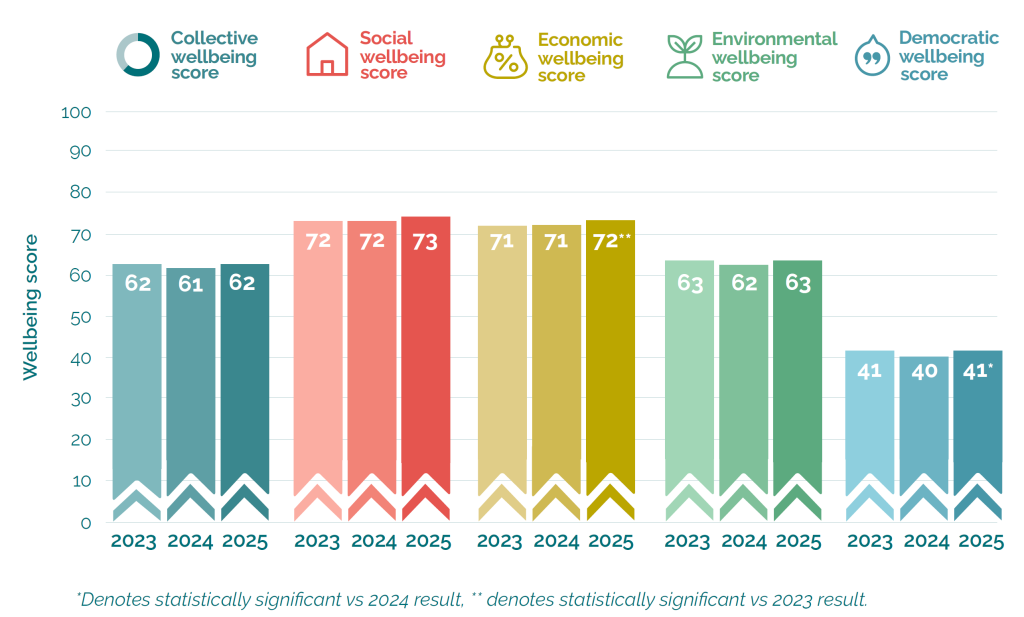
The UK’s collective wellbeing score for 2025 stands at 62 out of a possible 100. Although this number has fluctuated between 61 and 62 over the past three years, there has been no statistically significant change in the overall score.
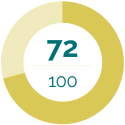
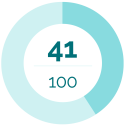
Notably, some domains have demonstrated progress: since 2023, economic wellbeing has registered a statistically significant increase of one point, reaching 72. Similarly, democratic wellbeing has improved in comparison to 2024, returning to its 2023 value, primarily due to heightened trust in the UK Government. It should be emphasised, however, that despite this improvement, the democratic wellbeing score remains critically low at 41, the lowest among the four domains evaluated in this report.
Enhancing collective wellbeing across the UK is a gradual process. Shifts in the overall measure are likely to materialise more slowly than those observed in individual domains, demographic groups, or jurisdictions, as collective wellbeing is shaped by a broad array of factors that may not (and are unlikely to) advance simultaneously.
Collective wellbeing in 2025: Scoring summary
Social
wellbeing
We all have the support and services we need to thrive.
Economic wellbeing
We all have a decent minimum living standard.

Environmental wellbeing
We all live within the planet’s natural resources.
Democratic wellbeing
We all have a voice in decisions that affect us.
Understanding what influences collective wellbeing
This year’s results point to where change is already happening and where more work needs to be done to improve the wellbeing of everyone in the UK. The small shifts we have already seen show that change is possible, and that effective policy and practice interventions can create the foundations for good wellbeing.
The index tells us that people’s experience of life in the UK varies substantially according to their circumstances, highlighting the reality of inequality between people and within communities across the UK.
In 2025 the following three factors stand out as particularly significant in predicting a lower or higher collective wellbeing score. These were also particularly significant in 2024:
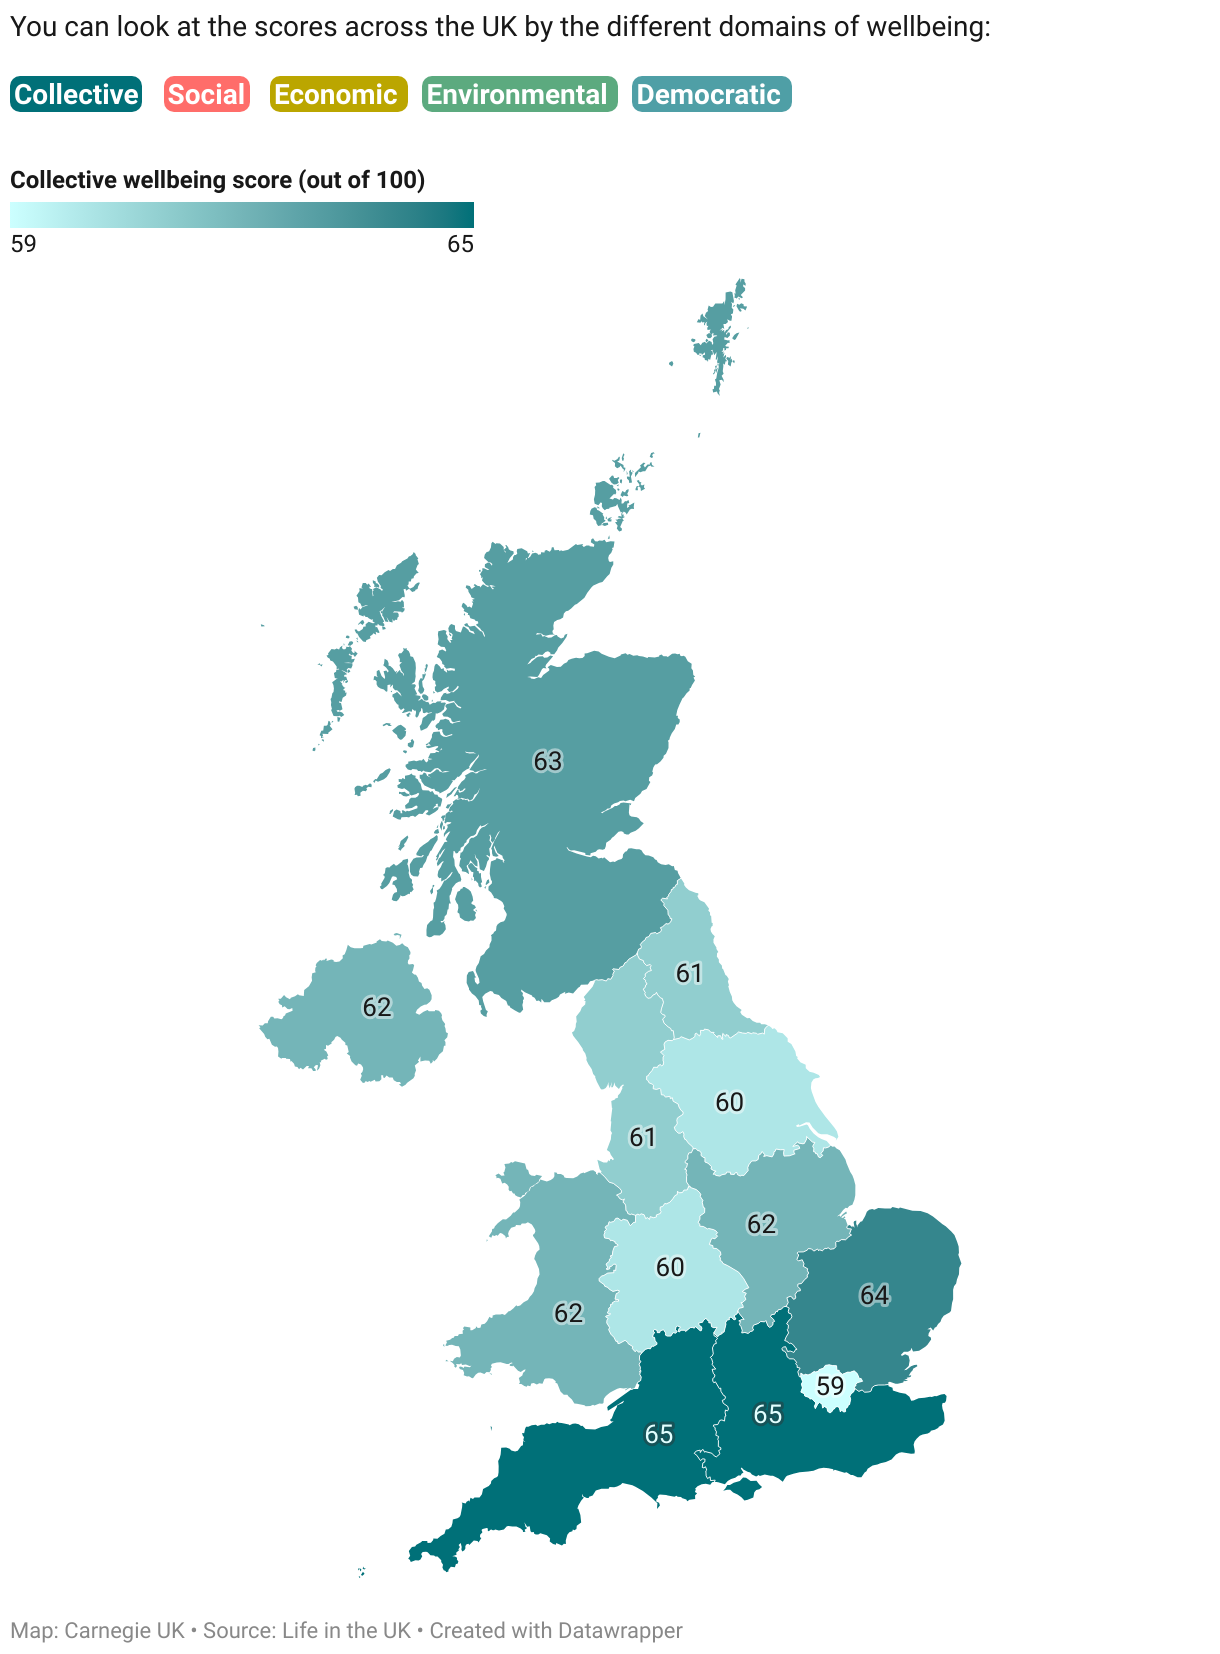
- The higher the household income, the higher the collective wellbeing score. People with annual household incomes of over £100,000 have a collective wellbeing score of 68. This is 12 points higher than for those with an annual household income under £26,000, who have a collective wellbeing score of 56. People with an annual household income of between £52,000 and £99,999 are also likely to have some of the highest collective wellbeing scores (66).
- As the level of area deprivation worsens, collective wellbeing decreases. People who live in the most deprived areas (IMD1*) have an average collective wellbeing score of 55. This is 12 points lower than for people living in the least deprived areas (67).
- Being disabled is strongly associated with lower wellbeing. Disabled people have an average collective wellbeing score of 55, which is nine points lower than for people who are not disabled (64).
The following are also notable influences on people’s collective wellbeing:
- Living in social housing: social tenants have a collective wellbeing score of 52. This is 13 points lower than for homeowners (65). Those who rent privately have a collective wellbeing score of 57.
- Age: people aged 55 and over have a collective wellbeing score of 66. This is seven points higher than for 16- to 34-year-olds (59).
- The number of children in a household: people with three or more children under the age of 16 in the household have an average collective wellbeing score of 56. This is seven points lower than for people with no children (63), and four points lower than for people with one or two children (each 60).
- Living in a rural area: people who live in rural areas have a collective wellbeing score of 67. People living in urban areas have a lower collective wellbeing score of 61.
- Gender: men have a collective wellbeing score of 63, compared to 61 for women.
- Ethnicity: People from an ethnic minority group (including White minorities), have a collective wellbeing score of 58, compared to 63 for those of White British ethnicity.
All of the above were also notable influences on collective wellbeing in 2024.
Collective wellbeing map
Social wellbeing is about everyone being able to achieve their potential and contribute to society because they have their basic needs met.
Our basic needs include having access to health and social care, education, housing, transport, digital resources and childcare.
To determine trends in social wellbeing across the UK, we asked questions about access to public services, community relationships, safety and community cohesion, and self-reported health and mental health.
The groups most likely to experience high levels of social wellbeing in the UK in 2025 remain the same as those identified in previous years:
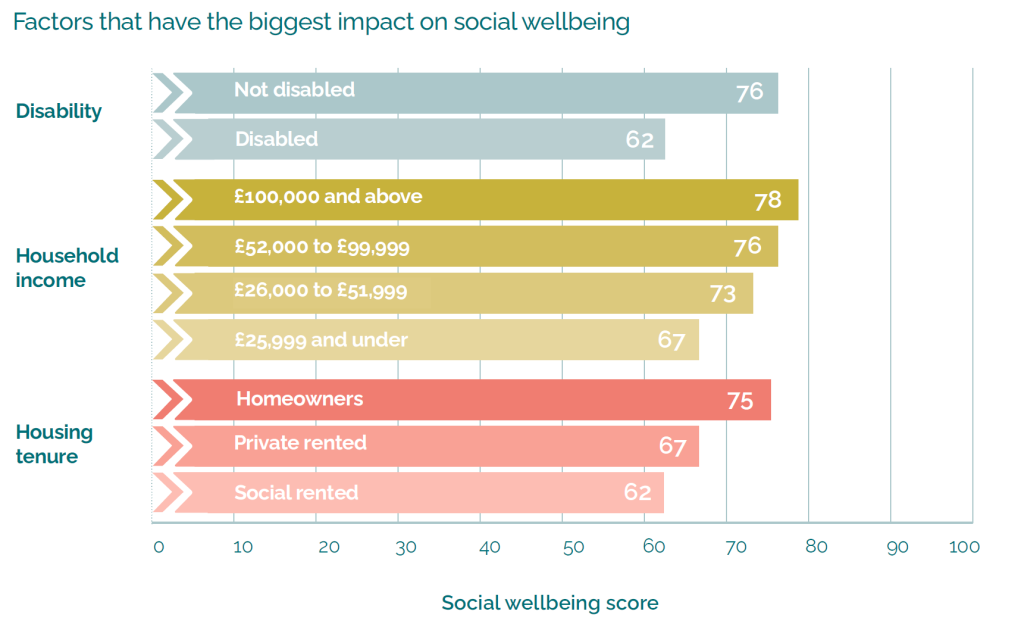
- People with an annual household income of above £100,000, who have an average social wellbeing score of 78. This is 11 points higher than for those with an income of up to £25,999 (67).
- People living in the UK’s least deprived areas (IMD5), who have a social wellbeing score of 77. This is 11 points higher than the score of people living in the most deprived areas (IMD1) (66).
- People aged over 55, who have a social wellbeing score of 76. This is seven points higher than the social wellbeing score of people aged 16 to 34 (69).
- Men, who have a social wellbeing score of 74. This is three points higher than for women (71).
The groups most likely to experience low levels of social wellbeing in the UK in 2025 are:
- Disabled people, who have a social wellbeing score of 62. This is 14 points lower than the average score of people who are not disabled (76).
- People living in social housing, who have a social wellbeing score of 62. This is 13 points lower than the score of homeowners (75).
- People from an ethnic minority group (including White minorities), who have a social wellbeing score of 67. This is seven points lower than for those of White British ethnicity (74).
- People living in urban areas, who have a social wellbeing score of 71. This is six points lower than for those living in rural areas (77).
Social wellbeing – standout statistics
Several social wellbeing statistics have changed slightly in 2025.
- 68% report that their general health is good or very good, and 65% that their mental health is good or very good, each three percentage points higher than in 2023.
- More than two in five (44%) have experienced discrimination in the last 12 months, four percentage points higher than in 2023.
- 34% report that it is easy to get a GP appointment at a time when they need one, three percentage points higher than in 2024. Almost half (48%) still say that they find it difficult.
Social wellbeing summary
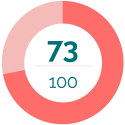
The UK’s social wellbeing score of 73 out of 100 in 2025 offers cautious optimism but it also demands urgent attention.
We are seeing small but meaningful improvements in people’s reported general health and mental wellbeing: these are welcome signs that progress is possible. However, the data continues to reveal deep and persistent inequalities. Disabled people, those on low incomes and social renters consistently report lower levels of social wellbeing. The downward pull of these factors remains significant and is not weakening.
This is not just a matter of individual hardship. It is a systemic issue that undermines our collective wellbeing. When basic needs, such as access to healthcare, housing, education, and community support are not met equitably, we all lose out.
The evidence is clear: income, place, and circumstance continue to shape people’s ability to live well. People with higher incomes, older adults and those in less deprived areas report significantly better outcomes. Meanwhile, those facing disadvantage are being left behind.
Carnegie UK believes that everyone should have what they need to live well together. Social wellbeing is the foundation of a thriving, resilient society.
The small improvements we see in 2025, which are particularly evident in how healthy people feel, show that change is possible with the right policy focus and sustained effort. But the scale of the challenge requires bold leadership and a shared purpose across government and civil society.
Economic wellbeing in 2025
The UK scores 72 out of a possible 100 for economic wellbeing.
Economic wellbeing means that everyone has a decent minimum living standard and can absorb financial shocks. This includes access to a decent income, affordability, financial resilience, job opportunities and skills.
To determine trends in economic wellbeing across the UK, we asked questions about skills and job availability, and the affordability of essential items like food and fuel.
The people most likely to experience high levels of economic wellbeing in the UK in 2025 are:
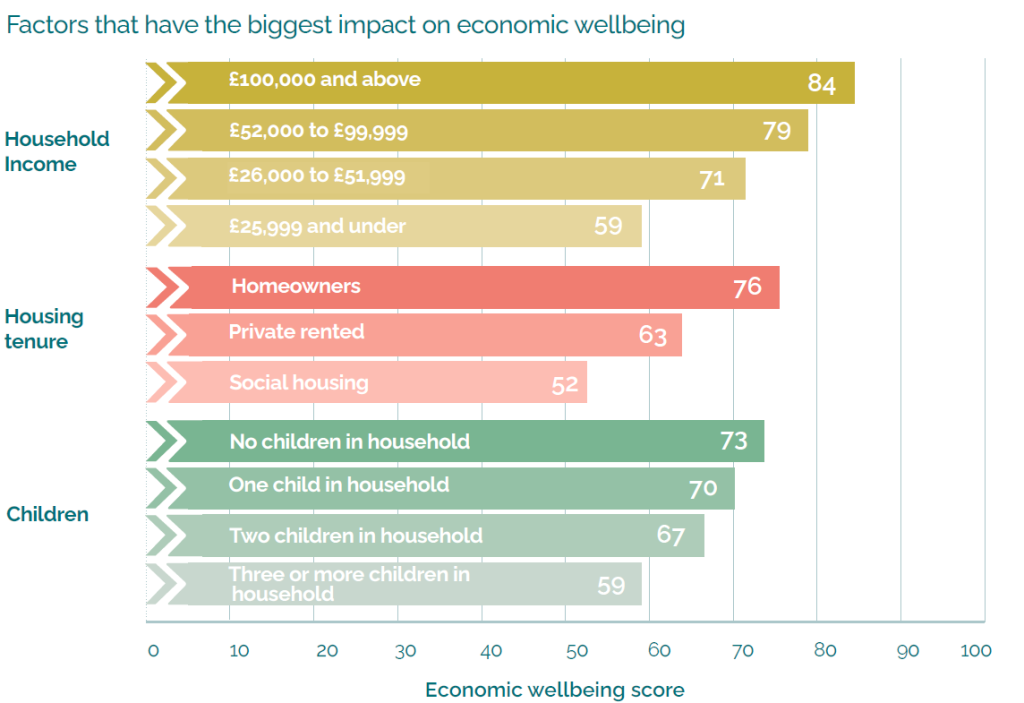
- People with an annual household income of above £100,000, who have an average economic wellbeing score of 84. This is 25 points higher than for people with an annual household income of up to £25,999 (59). People with a household income of £52,000 to £99,999 have an economic wellbeing score of 79.
- People who live in the least deprived areas, who have an economic wellbeing score of 78. This is 15 points higher than the score of people living in the most deprived areas (63).
- People over the age of 55, who have an economic wellbeing score of 76. This is seven points higher than for people aged 16 to 34 (69).
- Men, who have an economic wellbeing score of 73. This is two points higher than the economic wellbeing score of women (71).
The groups most likely to experience low levels of economic wellbeing in the UK in 2025 are:
- People living in social housing, who have an economic wellbeing score of 52. This is 24 points lower than the score for homeowners (76).
- People with three or more children under the age of 16 in the household, who have an average economic wellbeing score of 59. This is 14 points lower than for people with no children (73), 11 points lower than for people with one child (70), and eight points lower than for people with two children (67).
- Disabled people, who have an economic wellbeing score of 61. This is 14 points lower than the average score of people who are not disabled (75).
Economic wellbeing – standout statistics
With the exception of being dissatisfied with job opportunities in the local area, a number of small improvements can be seen in economic wellbeing over time.
- 79% agree that they can afford to keep their home warm, two percentage points higher than in 2024, and six percentage points higher than in 2023.
- 62% agree that their household could afford to pay an unexpected, but necessary, expense of £850, unchanged from previous years.
- Just over a quarter (26%) are satisfied with the availability of job opportunities for people in their local area, five percentage points lower than in 2023 and 2024.
Economic wellbeing summary
Economic wellbeing in the UK has shown small signs of improvement over the past year, with modest gains in people’s ability to meet essential needs and participate in everyday life. However, these gains are not evenly distributed, and longstanding inequalities continue to shape people’s experiences.
Economic wellbeing is not solely defined by having a certain level of income. It encompasses the capacity to afford basic necessities, withstand financial shocks, access secure and fulfilling employment, and develop the skills needed for future opportunities. This year’s findings reflect a complex picture: while some individuals report greater financial stability and improved living conditions, others remain at risk of exclusion and hardship.
Unsurprisingly, people living in households with higher incomes continue to report a higher sense of economic security than those on lower incomes, who experience greater difficulty in meeting day-to-day costs and planning for the future.
Individuals living in areas with lower levels of deprivation tend to report more positive experiences, while those in more disadvantaged communities face ongoing challenges. Similarly, people living in social housing often face greater financial strain and fewer opportunities than homeowners.
Family composition and disability further influence economic wellbeing. Larger families, particularly those with three or more children under the age of 16, often face increased financial pressure. Disabled people continue to report lower levels of economic wellbeing than people who are not disabled.
Despite these challenges, there are encouraging signs. More people feel able to keep their homes warm and participate in social activities. These improvements suggest that some aspects of economic life are becoming more manageable for a broader segment of the population. However, concerns remain and dissatisfaction with local job opportunities is rising.
If we are to address these issues, it should be our aspiration that everyone has access to fair work with a decent income, so that no one falls below a dignified living standard that enables them not just to survive but to prosper.
Environmental wellbeing in 2025
The UK scores 63 out of a possible 100 for environmental wellbeing.
Environmental wellbeing means that everyone has access to green and blue spaces and collectively we live within the planet’s natural resources, protecting the environment for future generations.
To determine trends in environmental wellbeing across the UK, we asked questions about access to and the quality of local parks, rivers and other green and blue spaces, and about noise pollution, air pollution, and litter in local areas. We also asked about levels of satisfaction with efforts to preserve the environment.
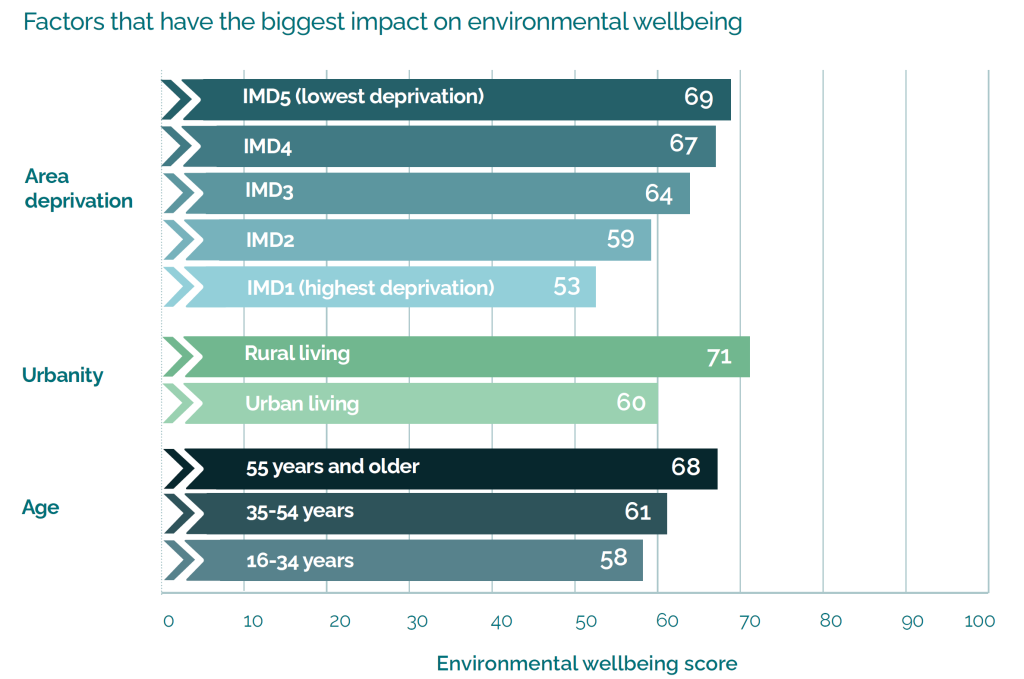
The people most likely to experience high levels of environmental wellbeing in the UK in 2025 are:
- People who live in the least deprived areas (IMD5), who have an environmental wellbeing score of 69. This is 16 points higher than for those in the most deprived areas (IMD1) (53).
- People aged over 55, who have an environmental wellbeing score of 68. This is 10 points higher than the score of 16- to 34-year-olds (58).
The people most likely to experience low levels of environmental wellbeing in the UK in 2025 are:
- People living in urban areas, who have an environmental wellbeing score of 60. This is 11 points lower than for those living in rural areas (71).
- Disabled people, who have an environmental wellbeing score of 59. This is five points lower than for people who are not disabled, who have an environmental wellbeing score of 64.
- People from an ethnic minority group (including White minorities), who have an environmental score of 57. This is seven points lower than for those of White British ethnicity (64).
There is no notable difference by income alone on this domain.
Environmental wellbeing –
standout statistics
There has been little overall change, but dissatisfaction remains high.
- Many people experience issues with litter (83%), noise (64%) and air quality (52%) in their neighbourhood. The proportion of people experiencing problems with litter and with noise pollution are each three percentage points higher than in 2023.
- 40% are dissatisfied with current efforts to preserve the environment. This dissatisfaction has lessened since 2024, when it was 44%.
- 12% are dissatisfied with the quality of their nearest local public, green or open space, the same as in previous years.
Environmental wellbeing summary
Like many of the other domains in this report, this year’s findings for environmental wellbeing indicate that it is shaped by a range of factors, including geography, age, whether or not a person is disabled, and ethnicity.
Individuals who live in the least deprived areas report better environmental conditions than those in the most deprived. Older people once more report higher levels of environmental wellbeing than younger people. Urban residents face greater exposure to negative environmental factors than those in rural areas, and disabled people consistently report lower levels of satisfaction with their local environment. These disparities have remained largely unchanged over the past year.
Ethnic inequalities are also evident. Respondents from ethnic minority groups (including White minorities) report lower levels of environmental wellbeing than those of White British ethnicity.
Across the UK, a substantial proportion of the population continues to report problems with litter, noise, and air pollution in their local areas. Except for air pollution, these issues have become slightly worse over the past year.
There are clear key demographic differences in environmental wellbeing, but the widespread nature of environmental problems and dissatisfaction with efforts to preserve the environment also point to a common understanding among people across the UK that our current environmental conditions are not good enough. Two fifths of people feel dissatisfied with efforts being taken to preserve the environment in the UK. This would suggest that there is appetite across the country for bold action in this space.
Democratic wellbeing in 2025
The UK scores 41 out of a possible 100 for democratic wellbeing.
Democratic wellbeing is about everyone having a voice in decisions that affect them. This means having local and national leaders who support participation, foster trust, and encourage diversity.
To understand democratic wellbeing in the UK in 2025, we asked questions about levels of trust in local, regional and national government(s) as well as other national institutions, perceptions of personal ability to influence decisions, and experiences of discrimination.
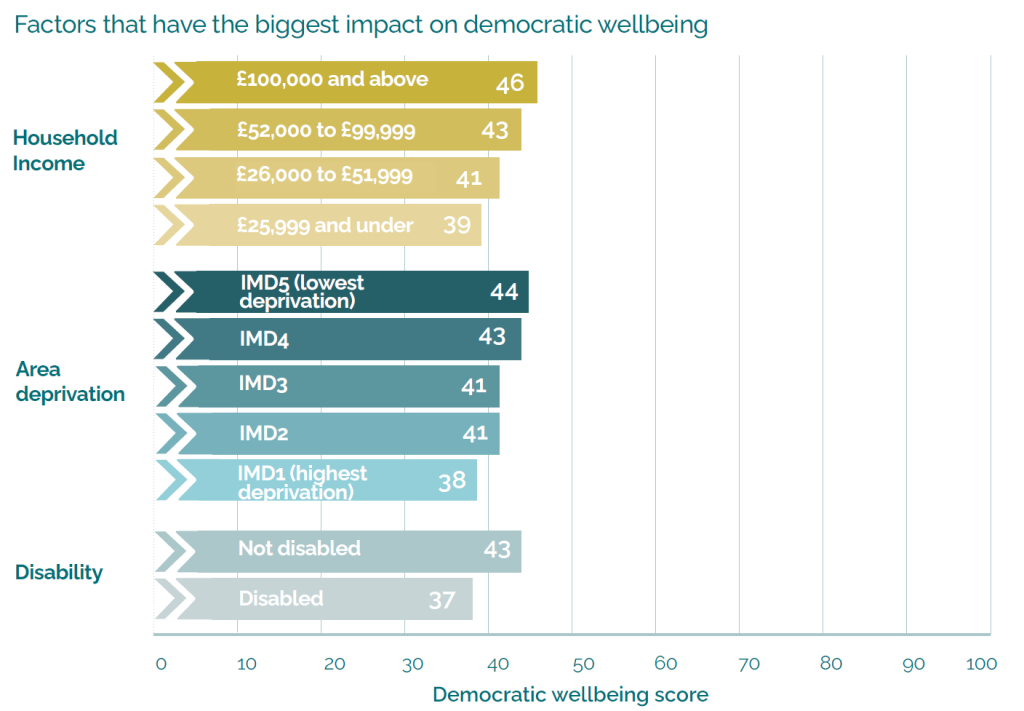
While markedly low across the board, and the lowest of any of our four wellbeing domains, the groups with the highest levels of democratic wellbeing in the UK in 2025 are:
- People with an annual household income of above £100,000, who have an average democratic wellbeing score of 46. This is seven points higher than for people with an annual household income of up to £25,999 (39).
- People living in the least deprived areas (IMD5), who have a democratic wellbeing score of 44. This is six points higher than the score of people living in the UK’s most deprived areas (38).
- People over the age of 55, who have a democratic wellbeing score of 43. This is two points higher than for people aged 16 to 34 (41).
The people most likely to experience low levels of democratic wellbeing in the UK in 2025 are:
- Disabled people, who have a democratic wellbeing score of 37. This is six points lower than for people who are not disabled (43).
- People living in social housing, who have a democratic wellbeing score of 37. This is six points lower than for people who are homeowners (43).
Democratic wellbeing – standout statistics
Trust in the UK Government has improved, but trust in other institutions is declining.
- 72% do not feel that they can influence decisions affecting the UK, unchanged on previous years.
- 68% have medium or high trust in local councils, four percentage points lower than in 2023.
- 54% have medium or high trust in the UK Government, nine percentage points higher than in 2024.
- 60% have low trust in social media and 42% have low trust in big tech companies like Google and Apple, both four percentage points higher than in 2024.
Democratic wellbeing summary
Democratic wellbeing in the UK remains notably low in 2025, with this domain continuing to score significantly lower than any other area of wellbeing. The findings again point to widespread public disengagement and a lack of trust in decision-making structures at both national and local levels. This is despite 2024 having seen the first major change in national party leadership in 14 years, and wide-ranging changes to local government administrations in 2025.
Democratic wellbeing is about whether people feel they have a voice in decisions that affect their lives. The index tells us that too many people across the UK feel disconnected from political processes and unsure about their ability to shape outcomes.
While scores are low across the board, some groups report slightly more positive experiences. People with higher household incomes and those living in less deprived areas tend to express greater trust in institutions and a stronger sense of influence. Older adults also report higher levels of democratic wellbeing than younger people.
Conversely, disabled people and those living in social housing continue to report lower levels of democratic wellbeing. These groups are more likely to feel excluded from decision-making and less confident in political institutions.
In addition, public trust in government and local councils remains fragile. Although trust in the UK government has risen by seven percentage points since 2024, most people still do not feel they can influence decisions affecting their local area or the country as a whole.
Trust in digital platforms and large technology companies is also low, with concerns about transparency and accountability continuing to grow. There has, however, been a small but significant improvement to trust in the news media.
These findings highlight the need for renewed efforts to strengthen democratic engagement. Improving trust, fostering inclusive participation, and ensuring that all voices are heard – especially those from underrepresented groups – will be essential to reverse current trends and build a more responsive and equitable democratic culture.
Get in touch
Want to chat about Life in the UK 2025? Get in touch with Susan.

Help us make the case for wellbeing policy
Keep in touch with Carnegie UK’s research and activities. Learn more about ways to get involved with our work.
"*" indicates required fields
Social wellbeing in 2025
The UK scores 73 out of a possible 100 for social wellbeing.