This is the latest edition of our annual Life in the UK – England index, now with four years’ worth of data trends, enabling us to take a slightly longer-term view of how people across England are living.
- Democracy
- Economy
- Environment
- Evidence and reports
- Inequality
- Measuring wellbeing
- Society
- Carnegie UK
- 9 November 2026
- ISBN: 978-1-917536-21-9
- 30 minute read
Our collective wellbeing in England 2026
Collective wellbeing is about everyone having what they need to live well now and into the future. It goes beyond individual happiness or health. Instead, it looks at the holistic, bigger picture: how our society, economy, environment and democracy work together to support people and communities.
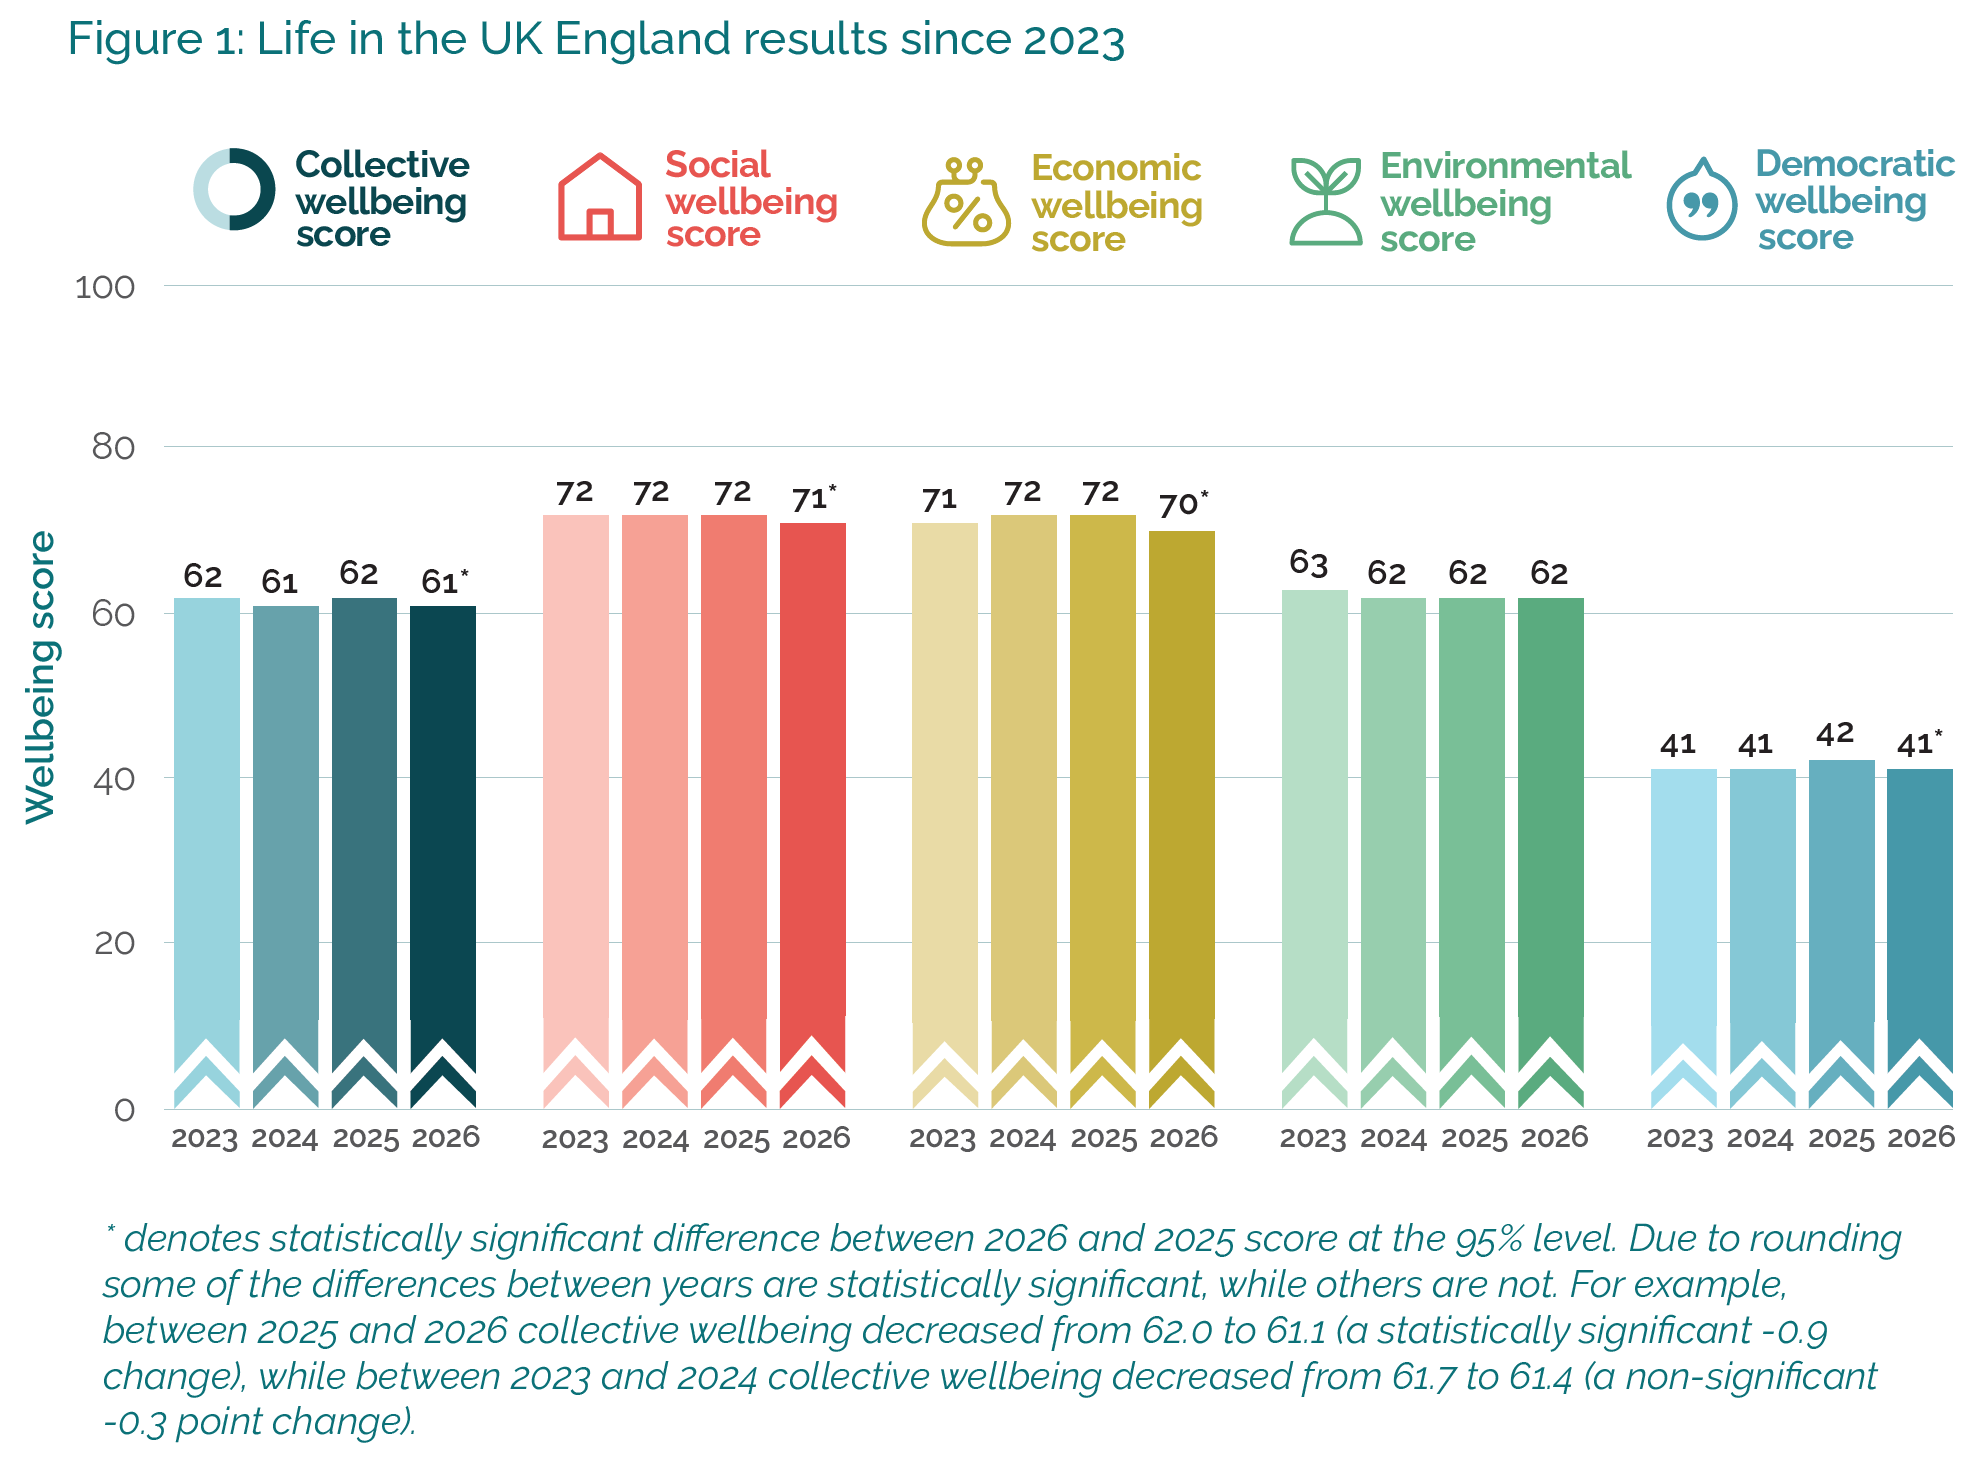
The overall score for collective wellbeing in England in 2026 is 61 out of a possible 100. This is one point lower than in 2025, marking the first statistically significant change in collective wellbeing that we have seen since Life in the UK began reporting in 2023.
This decline in collective wellbeing has been driven by losses in three of the four domains that Life in the UK considers. Social wellbeing is lower than previous years, and the same is true for democratic wellbeing, where the positive gains we saw in 2025 have been lost. Economic wellbeing in England is now at the lowest level since Life in the UK began.
The fact that negative changes have been seen in multiple domains is concerning and paints a picture of stalling and falling wellbeing that merits attention.
Understanding what influences collective wellbeing
The scores we have seen this year point to a picture of stagnation and, in many cases, decline for collective wellbeing in England. They also show where more policy attention needs to be directed, both in terms of the specific issues that make up each domain, and the demographic and circumstantial factors that affect wellbeing.
As in previous years, we find that people’s experience of life varies substantially according to their circumstances, highlighting the reality of inequality between people and within communities across England.
In 2026 the following factors stand out as particularly significant in predicting a lower or higher collective wellbeing score in England:
- Having a household income of below £26,000 a year. People with annual household incomes of up to £25,999 have a collective wellbeing score of 54. This is 13 points lower than for those with an annual household income of £100,000 and above (67). People with annual household incomes of between £52,000 and £99,999 have a collective wellbeing score of 65, and those with annual household incomes of between £26,000 and £51,999 have a collective wellbeing score of 61.
- Being disabled. Disabled people have a collective wellbeing score of 54, nine points lower than for people who are not disabled (63).
- Living in a deprived area. People who live in the most deprived areas (IMD1) have a collective wellbeing score of 54. This is 12 points lower than for people living in the least deprived areas (66).1
- Living in social housing. People who live in social housing have a collective wellbeing score of 50. This is 14 points lower than for homeowners (64). Private tenants also have a lower collective wellbeing score of 57.
The following factors are also notable influences on collective wellbeing:
- Being 55 or over. People aged 55 and over have a collective wellbeing score of 64. This is five points higher than for people aged 16 to 34 or 35 to 54 (each 59).
- Region. People living in the South West of England have a collective wellbeing score of 65. This is four points higher than the average for England (61).
- Being a graduate. Graduates have a collective wellbeing score of 64, four points higher than for non-graduates (60).
- Being lesbian, gay, bisexual or another sexuality that is not heterosexual (LGB+). LGB+ people have a collective wellbeing score of 58, four points lower than for heterosexual people (62).
- Living in a rural area. People who live in rural areas have a collective wellbeing score of 65, while those living in urban areas have a collective wellbeing score of 60.
- Being a man. Men have a collective wellbeing score of 63, compared to 60 for women.
- Being from an ethnic minority group, including White minorities. People from Black, Asian and minority White ethnic groups and people with mixed ethnic backgrounds have a collective wellbeing score of 57, six points lower than for White British people (63).
Collective wellbeing map
Social wellbeing is about everyone being able to achieve their potential and contribute to society because they have their basic needs met. Our basic needs include feeling healthy, having access to services, feeling safe in and connected with our communities, and being free from discrimination.
To determine trends in social wellbeing across England, we asked questions about access to services, community relationships, safety and community cohesion, and self-reported health and mental health.
The groups most likely to experience high levels of social wellbeing in England in 2026 are:
- People aged 55 and over, who have a social wellbeing score of 75, seven points higher than for people aged 16 to 34 (68). People aged 35 to 54 have a social wellbeing score of 71.
- People who live in the South West of England, who have a social wellbeing score of 76, five points higher than the England average (71) and eight points higher than for those in the North East of England (68).
- Men, who have a social wellbeing score of 74. This is five points higher than for women (69).
- Graduates, who have a social wellbeing score of 74, which is four points higher than for non-graduates (70).
- People who live in rural areas, who have a social wellbeing score of 75, five points higher than for those living in urban areas (70).
The groups most likely to experience low levels of social wellbeing in England in 2026 are:
- Disabled people, who have a social wellbeing score of 60, 15 points lower than for people who are not disabled (75).
- People who live in social housing, who have a social wellbeing score of 60, 14 points lower than for homeowners (74). People who rent their home from a private landlord have a social wellbeing score of 67.
- People who have an annual household income of below £26,000, who have a social wellbeing score of 63. This is nine points lower than for those with an annual household income of between £26,000 and £51,999 (72), and 13 points lower than for those whose annual household income is £52,000 and above (76).
- LGB+ people have a social wellbeing score of 64, eight points lower than for people who are heterosexual (72).
- People who live in the most deprived areas (IMD1), who have a social wellbeing score of 64, 12 points lower than for those in the least deprived areas (76).
- People from an ethnic minority background, including White minorities, who have a social wellbeing score of 67, six points lower than for those from a White British background (73).
Social wellbeing: breakdown of results
Small downward shifts in several areas of social wellbeing have led to a drop in the headline figure.
The figures below show the trends since 2023 in the questions we ask around social wellbeing.
Perceptions of general and mental health
- Just under one in 10 (8%) people experience bad general health, two percentage points higher than last year.
- Just under one in 10 (9%) people experience bad mental health, similar to previous years.
Community cohesion
- Seven in ten (70%) people feel safe walking alone in their local neighbourhood after dark, seven percentage points lower than in Scotland and six percentage points lower than in Wales.
- Just under two-thirds (65%) of people felt that if they were alone and needed help, they could rely on someone in their neighbourhood to help them, lower than the UK average.
- 45% of people in England have experienced discrimination in the last 12 months, four percentage points higher than in 2023.
Access to services
- One in six (17%) people find it difficult to access public transport that gets them where they need to go, similar to previous years.
- 87% of people find it easy to access a grocery shop or supermarket in person, two percentage points lower than in 2023.
- Two in five (39%) people now find it easy to get a GP appointment at a time when they need one, 10 percentage points higher than in 2023.
Social wellbeing summary
England’s social wellbeing score of 71 out of 100 in 2026 represents a small but concerning drop compared to 2025, and is lower than it was in 2023, when Life in the UK first reported.
The small improvements we saw last year in people’s reported general health have been lost, and the proportion of people experiencing discrimination remains higher than it was in 2023.
As we have seen in previous years, people in England feel less likely than people in Scotland and Wales to feel safe walking in their neighbourhood after dark. People in England are also less likely than people in Northern Ireland and Scotland to feel they could rely on other people in their neighbourhood if they were alone and needed help.
However, while there is cause for concern across this year’s findings, we have continued to see progress in people’s ease with accessing GP appointments at a time when they need one. This has grown year on year, from 29% in 2023 to 39% this year, a welcome sign of progress.
The data once again show that there are real and persistent inequalities in how people experience life depending on their characteristics. Those at risk of especially poor social wellbeing include disabled people, those who live in social housing, and those with low annual household incomes.
Economic wellbeing in England 2026
England scores 70 out of a possible 100 for economic wellbeing.
Economic wellbeing means that everyone has a decent minimum living standard and can absorb financial shocks. This includes access to a decent income, affordability, financial resilience, job opportunities and skills.
To determine trends in economic wellbeing across England, we asked questions about skills and job availability, and the affordability of essential items like food and fuel.
The people most likely to experience high levels of economic wellbeing in England in 2026 are:
- People aged 55 and over, who have an economic wellbeing score of 75, eight points higher than for those aged 35 to 54 (67). People aged between 16 and 34 have an economic wellbeing score of 68.
- Graduates, who have an economic wellbeing score of 76, eight points higher than for non-graduates (68).
- People living in the South West of England, who have an economic wellbeing score of 74, four points higher than the England average (70) and eight points higher than for those living in the West Midlands or the North East (each 66).
The groups most likely to experience low levels of economic wellbeing in England in 2026 are:
- People with an annual household income of below £26,000 a year, who have an economic wellbeing score of 57. This is 26 points lower than for those with annual household incomes of £100,000 and above (83). People with an annual household income of between £52,000 and £99,999 have an economic wellbeing score of 78, and those with annual household incomes of between £26,000 and £51,999 have an economic wellbeing score of 69.
- People who live in social housing, who have an economic wellbeing score of 50, 25 points lower than for homeowners (75). Those who rent privately also have some of the lowest economic wellbeing scores (63).
- Disabled people, who have an economic wellbeing score of 61, 12 points lower than for people who are not disabled (73).
- People who live in households with one or more children under the age of 16, who have an economic wellbeing score of 66, five points lower than for those in households with no children (71).
- People living in the most deprived areas (IMD1), who have an economic wellbeing score of 60, 17 points lower than for those living in the least deprived areas (77).
- Women, who have an economic wellbeing score of 68, four points lower than for men (72).
- People who are religious, who have an economic wellbeing score of 69, three points lower than for those who have no religion (72).
Economic wellbeing: breakdown of results
People are finding it harder to achieve a decent living standard, and satisfaction with local job opportunities is the lowest yet recorded by Life in the UK for England.
The figures below show the trends since 2023 in the questions we ask around economic wellbeing.
Perceptions of education, skills and local job opportunities
- Four in five (80%) people are satisfied with their education and skills, similar to previous years.
- Just one in five (22%) people are satisfied with the availability of jobs in their local area, four percentage points lower than 2025 and nine percentage points lower than 2024.
Affordability of essential items
- 87% of people agree that they can afford to buy enough food for everyone in the household, two percentage points lower than in 2025.
- 12% of people cannot afford to heat their homes adequately, though this is a five percentage-point improvement compared to 2023.
- Over a quarter (28%) of people could not afford an unexpected but necessary expense of £850, similar to previous years.
Affordability of leisure activities
- Four in five (79%) people can afford to socialise outside their home once a month, similar to previous years.
- Just under two-thirds (65%) of people can afford to pay for a week’s annual holiday away from home, four percentage points lower than in 2025.
Economic wellbeing summary
At 70 out of 100, the economic wellbeing of people in England has deteriorated by two points this year and is at its lowest figure since Life in the UK began reporting in 2023.
As last year, people are still finding it easier to heat their homes than they did in 2023. However, worryingly, people are less likely this year than in the last two years to say that they can afford to buy enough food for everyone in the household.
Beyond meeting essential needs, people are finding it harder than they did last year to afford to socialise outside of their homes once a month, or to go away on holiday away from home once a year.
There is also wide variation in economic wellbeing according to people’s situations and backgrounds, continuing existing inequalities. It remains unsurprising but true that those on lower household incomes continue to have far lower economic wellbeing than those with the highest incomes, and face difficulties in meeting everyday costs. A similar gap exists between those living in social housing and those who own their own homes, as well as between people who are disabled and those who are not. Other factors including age, level of education, where someone lives, whether there are children in the household, and religion all impact economic wellbeing.
Last year, we noted that dissatisfaction with local job opportunities was rising. This year has only compounded that trend.
Environmental wellbeing in England 2026
England scores 62 out of a possible 100 for environmental wellbeing.
Environmental wellbeing means that everyone has access to green and blue spaces and collectively we live within the planet’s natural resources, protecting the environment for future generations.
To determine trends in environmental wellbeing across England, we asked questions about access to and the quality of local parks, rivers and other green and blue spaces, and about noise pollution, air pollution, and litter in local areas. We also asked about levels of satisfaction with efforts to preserve the environment.
The people most likely to experience high levels of environmental wellbeing in England in 2026 are:
- People living in rural areas, who have an environmental wellbeing score of 71, 11 points higher than for those in urban areas (60).
- People aged 55 and over, who have an environmental wellbeing score of 66, eight points higher than for people aged 16 to 34 years old (58).
- Graduates, who have an environmental wellbeing score of 63, one point higher than for non-graduates (62).
The groups most likely to experience low levels of environmental wellbeing in England in 2026 are:
- People living in the most deprived areas (IMD1), who have an environmental wellbeing score of 53, 16 points lower than for those in the least deprived areas (69).
- People living in London, who have an environmental wellbeing score of 55, seven points lower than the average for England (62).
- People with an annual household income of below £26,000, who have an environmental wellbeing score of 57, eight points lower than for those with an annual household income of above £52,000 (65). Those with annual household incomes of between £26,000 and £51,999 have an environmental wellbeing score of 62.
- Disabled people, who have an environmental wellbeing score of 59, four points lower than for people who are not disabled (63).
Environmental wellbeing: breakdown of results
There have been few changes in environmental wellbeing since last year, but people in England are more likely to experience problems with pollution than people in other parts of the UK.
The figures below show the trends since 2023 in the questions we ask around environmental wellbeing
Issues with quality of local environment
- Two-thirds (66%) of people experience problems with noise pollution in their local area, similar to last year, but four percentage points higher than 2023 and higher than in Scotland and Northern Ireland.
- More than half (55%) experience problems with air quality in their local neighbourhood, higher than in Scotland, Wales, and Northern Ireland.
- Four in five (82%) people experience problems with litter in their local area, similar to previous years.
Perception of local public, green or open space and efforts to preserve the environment in the UK
- Just over two-thirds (69%) of people are satisfied with the quality of their local public, green or open space, similar to previous years.
- Two in five (40%) are dissatisfied with efforts to preserve the environment in the UK, similar to 2025 but an improvement of four percentage points since 2023.
Environmental wellbeing summary
Unlike other domains in this report, England’s environmental wellbeing has remained steady this year.
Nonetheless, many people continue to experience problems with noise pollution, air quality, and local litter. Both noise pollution and air quality are more likely to be problematic in England than in other parts of the UK.
Like last year, more people are satisfied with efforts to preserve the environment in the UK than in 2023 and 2024, but satisfaction with this is still low at 27%.
It is also true, as for other domains, that environmental wellbeing is shaped by factors like where someone lives, their age, and their income. These inequalities have remained evident across the years.
Democratic wellbeing in England 2026
England scores 41 out of a possible 100 for democratic wellbeing.
Democratic wellbeing is about everyone having a voice in decisions that affect them. This means having local and national leaders who support participation, foster trust, and encourage diversity.
To understand democratic wellbeing in England in 2026, we asked questions about levels of trust in local, regional and national government(s) as well as other national institutions, and perceptions of personal ability to influence decisions.
While markedly low across the board, and the lowest of any of our four wellbeing domains, the people with the highest levels of democratic wellbeing in England in 2026 are:
- People with an annual household income of £100,000 or more a year, who have a democratic wellbeing score of 44, six points higher than for those with annual household incomes of below £26,000 a year (38).
- Those who do not work full time, who have a democratic wellbeing score of 42, three points higher than for full-time workers (39).
- Graduates, who have a democratic wellbeing score of 43, three points higher than for non-graduates (40).
The groups most likely to experience low levels of democratic wellbeing in England in 2026 are:
- People in the North East of England, who have a democratic wellbeing score of 37, four points lower than the England average (41) and six points lower than for people in the South West of England (43).
- Disabled people, who have a democratic wellbeing score of 38, four points lower than for people who are not disabled (42).
- People living in the most deprived areas (IMD1), who have a democratic wellbeing score of 37, six points lower than for those in the least deprived areas (43).
- Women, who have a democratic wellbeing score of 40, one point lower than for men (41).
Democratic wellbeing: breakdown of results
The improvements we saw in trust in the UK government in 2025 have not been sustained, and people remain unlikely to feel they can influence decisions that affect them. Trust in other key institutions like the news media and the legal system has also deteriorated this year.
The figures below show the trends since 2023 in the questions we ask around democratic wellbeing.
Perceptions of ability to influence decisions
- Fewer than one in ten (7%) people feel they can influence decisions affecting the UK, while only 14% feel they can influence decisions affecting their local area.
Trust in government and politicians
- Nearly half (47%) of people have low trust in the UK Government, four percentage points higher than in 2025, though still a five-point improvement compared to 2024.
- Nearly half (49%) of people have low trust in MPs, five percentage points higher than in 2025 and similar to 2023.
- Three in ten (29%) people now have low trust in the local council for their area, four percentage points higher than in 2023.
Trust in institutions
- A quarter (24%) of people have high trust in the police, similar to previous years.
- One in five (22%) people have low trust in the legal system and courts, six percentage points higher than in 2023.
- Three in ten (30%) people have high trust in banks, four percentage points higher than in 2024.
Trust in media and tech
- Just under four in ten (38%) people have low trust in the news media, five percentage points higher than in 2025 and the same as in 2023.
- Six in ten (60%) people have low trust in social media, six percentage points higher than in 2023.
- 45% of people have low trust in big tech companies, 10 percentage points higher than in 2023.
Democratic wellbeing summary
In last year’s report we found that democratic wellbeing had improved, but this gain has been lost: at 41, democratic wellbeing has returned to the score of previous years. This troublingly low score indicates widespread lack of trust in political and civil society institutions, as well as a perception that people are unable to influence decisions that affect them.
Nearly half of people have low trust in the UK Government, a statistically significant loss since the upward turn of the 2025 findings – albeit still a slight improvement on findings from 2023 and 2024. In addition, despite the changes resulting from the May 2026 local elections, people are no more likely to trust the local council for their area than they were last year. Indeed, the level of trust in local councils is lower in 2026 than it was in 2023. Similarly, people are no more likely than in previous years to feel that they can influence decisions affecting their local area.
Some people are at higher risk than others of experiencing low democratic wellbeing, including people with lower household incomes and people who work full-time. Meanwhile, those in the South of England and in London, and those with a graduate-level qualification have higher democratic wellbeing.
Get in touch
Want to chat about Life in the UK 2026 England? Get in touch with Susan.

- Indices of multiple deprivation (IMD) is a measure of relative deprivation for small, fixed geographic areas of the UK. IMD classifies these areas into five quintiles based on relative disadvantage, with quintile 1 (‘IMD1’) being the most deprived and quintile 5 (‘IMD5’) being the least deprived. ↩︎
Help us make the case for wellbeing policy
Keep in touch with Carnegie UK’s research and activities. Learn more about ways to get involved with our work.
"*" indicates required fields
Social wellbeing in England 2026
England scores 71 out of a possible 100 for social wellbeing.